The Dip Chart area has recently received some updates that make dip lookups lightning quick, and also accurate along the entire tank length.
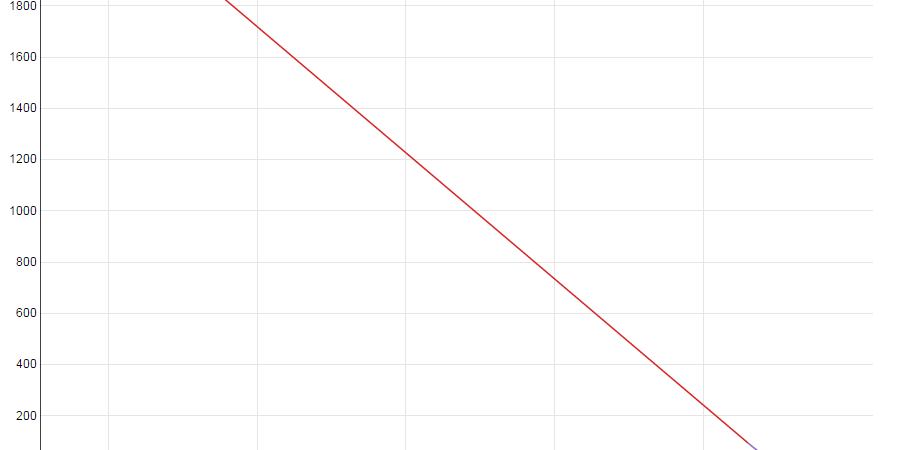
Previously there was no easy way to verify that your dip charts were working correctly, short of entering a lot of dips and checking that the volumes returned by Vinsight made sense. Now all you have to do is visit the Dip Chart detail page and you will be presented with a nice graph that shows how your vessel volume varies as the dip changes.
This graph is colour coded for the different sections of the tank: riser, top cone, barrel and bottom cone. This helps you to instantly see how the volume changes when you are inside each of these sections. Riser and barrel volumes change in a straight line as they are simply cylinders. The top cone and bottom cone are curved as they get larger or smaller as you progress through them.
We have also added a section for you to test dip values directly on the page you are managing them from. This is useful if you are not in an operation but you just need to convert between dip and volume for a given tank:
Both the chart and the dip lookup test changes in real time as you edit the various tank parameters. This makes it really obvious what your changes are going to do to the shape of the dip chart and to your lookup values.


