Create, customise and and save your favourite reports without having to re-populate filters and parameters every time.
Every business is unique and the information required by each can vary greatly. As we are continuously allowing for greater customisation in our reports, we have now added a feature to enable you to save those reports you access most often.
For example, let’s say you commonly want to track and compare sales made in Australia, state by state for the current financial year. . .
The ‘Sales By Period’ report (one of our most flexible reports) is a good place to start when looking for any customised sales information. Note, while, in this particular example, the ‘Sales By Territory And Customer’ could also be used, it is good to get used to using ‘Sales By Period’ as it ultimately gives you more flexibility as to how you group the data and the columns you display. It also has the ‘compare by’ feature which allows you to compare sales by month, quarter or year.
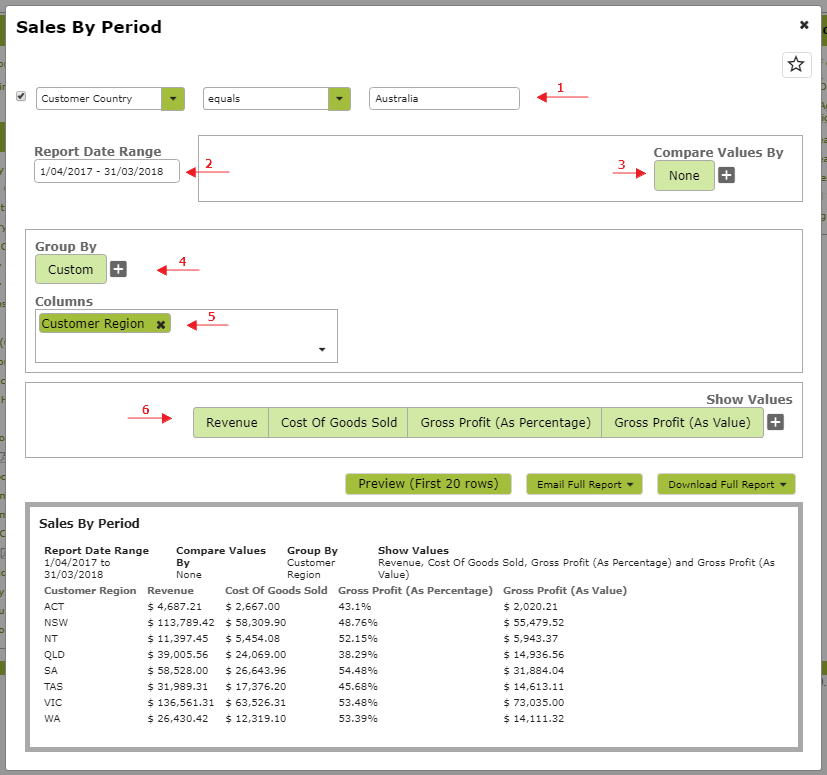
Here we create the report we want by filtering for Australian customers (1), selecting ‘Financial Year to Date’ from the Date drop down list (2), selecting ‘None’ for ‘Compare Values By’ (3) (This is because we are after total figures, rather than e.g. comparing month to month or year to year), selecting a ‘Custom’ group by (4) and then picking ‘Customer Region’ from the drop down list (5), and finally selecting the columns we want displayed from the ‘Show Values’ list (6).
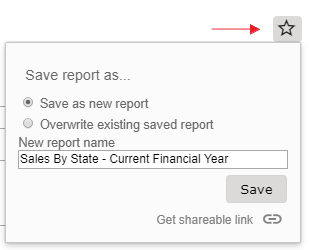
As this is information we want to access regularly, we don’t want to have to think through that process every time. To save this search simply click the star at the top right of the report, give your report a name, and save.
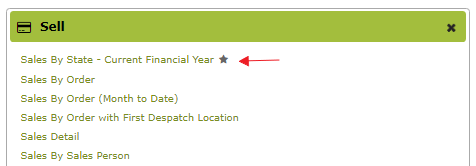
The report you created will now be available on your Reports List. The ‘star’ next to it makes it easy to identify as a customised report. Just click on this link to view an up to date version of the report you previously prepared.


